How We Estimate Downloads, Revenue and Ad Spend (Methodology v0)
The three models behind every DataPussy estimate, what we observe and what we model, how grades work, what we refuse to show, and how the method gets versioned. Version 0, and subject to change.
Methodology v0 — subject to change. This is the method we're building toward launch. It will change as ground truth comes in. Every estimate carries a
method_version, so you can always tell which version produced a number.
Nobody outside Apple and Google knows how many times an app was downloaded or how much it earned. Not us, not anyone selling you a dashboard. Every figure you see from a third party is a model. The only honest question is whether the model is shown to you or hidden from you.
This post shows you ours.
What We Observe and What We Model
Start with the split, because everything else depends on it.
Observed means we saw it ourselves, on a public page or an official endpoint, at a specific time:
- Chart ranks from Apple's official RSS feeds, overall and per genre, and from Google Play's public charts.
- Ratings counts, review velocity, prices, listed in-app purchases, versions and metadata from Apple's official lookup endpoints and from public store pages.
- Install brackets that Google Play shows publicly on each listing.
- Ads from Meta's official Ad Library API in the EU and Russia.
Modeled means we computed it: downloads, revenue and ad spend. These are always labeled "Estimate — modeled", in the dashboard, the API, the MCP server, webhooks and exports.
Verified means a developer connected real data through Claim your app and agreed to show it. That figure is never mixed into the modeled one.
Every field carries its source, its kind and its observed_at date. You never have to guess which bucket a number came from.
M1: From Rank to Downloads
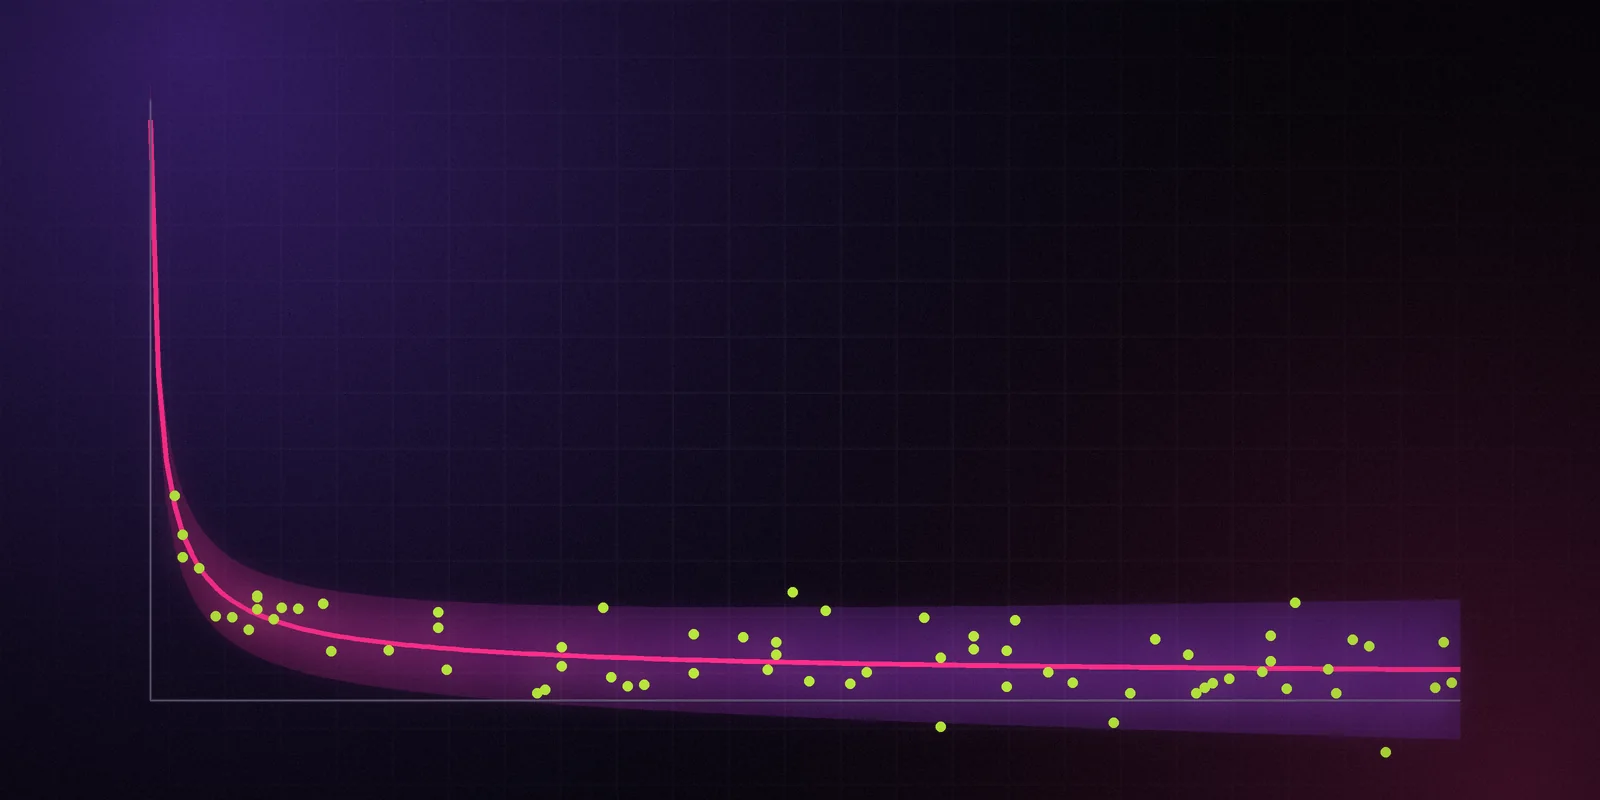
Chart rank is the strongest public signal of downloads. The relationship has a familiar shape: a few apps at the top take a large share, then a long tail flattens out. A power law describes that shape well, roughly downloads ≈ a × rank^(−b).
The parameters aren't the same everywhere. A rank in US Games doesn't mean what the same rank means in Japanese Medical. So M1 is hierarchical: it fits parameters per platform, country, chart and category, and lets thin segments borrow strength from their neighbors. Borrowed strength comes with a cost, and the cost shows up as a wider band.
On Google Play, the public install brackets help. A bracket tells us a floor and a ceiling for cumulative installs, so we treat it as an interval the model has to respect, not as a number.
At launch, M1 runs daily only for apps with live signal: apps that sit in a chart or had a ratings change in the last 30 days. Everything else gets a monthly estimate.
M3: From Downloads to Revenue
Revenue is downloads times what each download is worth. We break that into parts we can reason about:
downloads × paywall conversion × price × regional index
- Paywall conversion depends on the paywall type. A hard paywall at onboarding converts differently from a freemium app with a few gated features. We read paywall types from public store listings.
- Price comes from the in-app purchases and prices listed on public product pages.
- Regional index adjusts for how spending differs across countries.
Then we reconcile with Top Grossing. The Top Grossing chart ranks apps by revenue. If our model puts one app above another in revenue but the chart says otherwise, the model gets pulled toward the chart, and the band widens where the two disagree.
One limit we state plainly: revenue earned on the web, outside the stores, is only partly visible to us. When it's part of the picture, the estimate is flagged lower_bound: true. We'd rather say "at least" than invent a total.
We call it M3 because M2 doesn't ship at launch.
M4: Ad Spend Bands
Ad spend is modeled as reach × frequency × CPM. In the EU and Russia, reach comes from the official Ad Library. Frequency and CPM come from category and country assumptions that are part of this methodology and versioned with it.
Each of those three terms is uncertain, so the output is a band, not a number. Ad spend is a Beta feature at launch, and the coverage is declared per source and per country.
Grades: How Far to Trust the Band
Every estimate has a grade from A to D. The band tells you how wide the range is. The grade tells you how much to trust the band itself, based on which inputs were available, how well that segment is calibrated against real data, and the segment itself.
One rule matters more than the rest: segments without ground truth get a D by rule. If we have no real data to check a segment against, we can't claim to know how good our band is there, and the grade says so. There's a full post on grades if you want the details.
What We Won't Show
Some numbers do more harm than good. We don't publish them.
- No point estimate below roughly 10k downloads or roughly $10k a month. Small numbers are where models are most wrong and where a fake-precise figure misleads the most. You'll see
suppressed: trueinstead. - No point estimate for apps published by individual people. Seller name only, no contact details, and those pages aren't indexed by search engines.
- No final number for the last 72 hours. Those days are flagged
provisional, because charts and ratings are still settling. - No app's own private data in its public estimate. When a developer shares real figures, we test leave-one-out: their app's public estimate is built without them, unless they agree to show the verified number.
How the Method Changes
The method will change. That's the point of measuring it.
- Every estimate carries
method_version. - Every change to a model ships with a changelog entry that says what changed and why.
- Before a new version goes live, it's backtested against the ground truth we have.
- Once a month, the accuracy bulletin reports how often real values landed inside our P10–P90 band, by segment, with a minimum cell size so no segment is judged on a handful of apps.
Ground truth comes from developers who connect RevenueCat or Stripe through Claim your app, and from partner apps that share real figures with us. At launch, iOS estimates ship as "calibrated on N apps", with N stated on the methodology page. Where the evidence is thin, the grades are C or D, and they'll stay that way until the evidence improves.
What's Not in v0
A model for apps outside the charts, keyword-driven estimates, install attribution and active users all come after launch, not before. When they arrive, they'll get their own version numbers, their own changelog entries and their own lines in the accuracy bulletin.
If something in this method looks wrong to you, tell us. A methodology that can't be challenged isn't a methodology. It's a marketing claim.
More from the blog
Methodology, honest numbers and the tools around them.
Why Every Number Ships With a Range
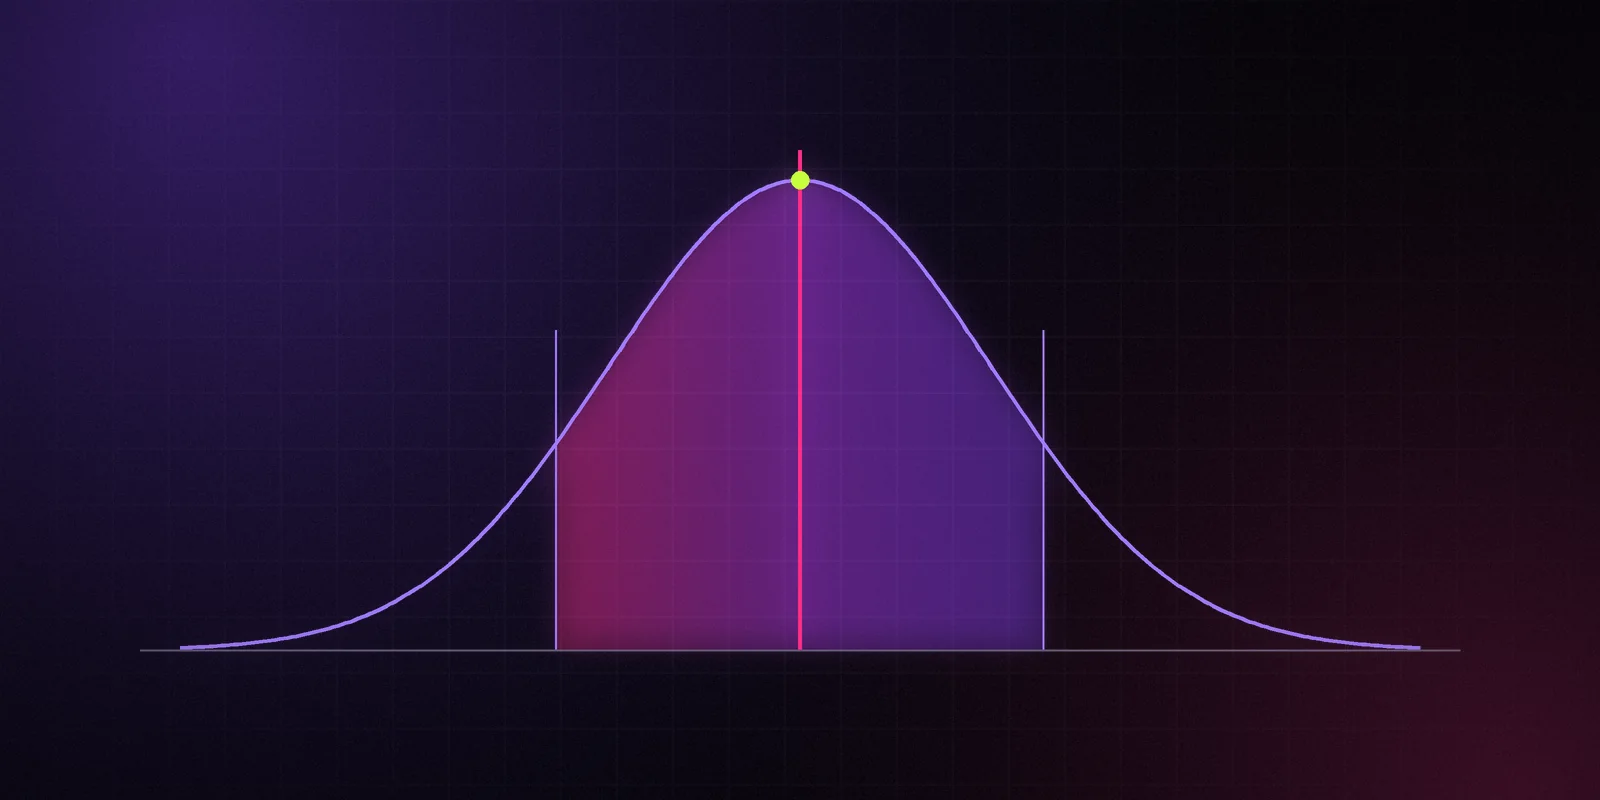
A single download figure hides how unsure the model is. Here is how to read P10, P50 and P90, why a wide band is information rather than failure, and how to make decisions with ranges.
DataPussy Team
Methodology
What A, B, C and D Mean on a DataPussy Estimate
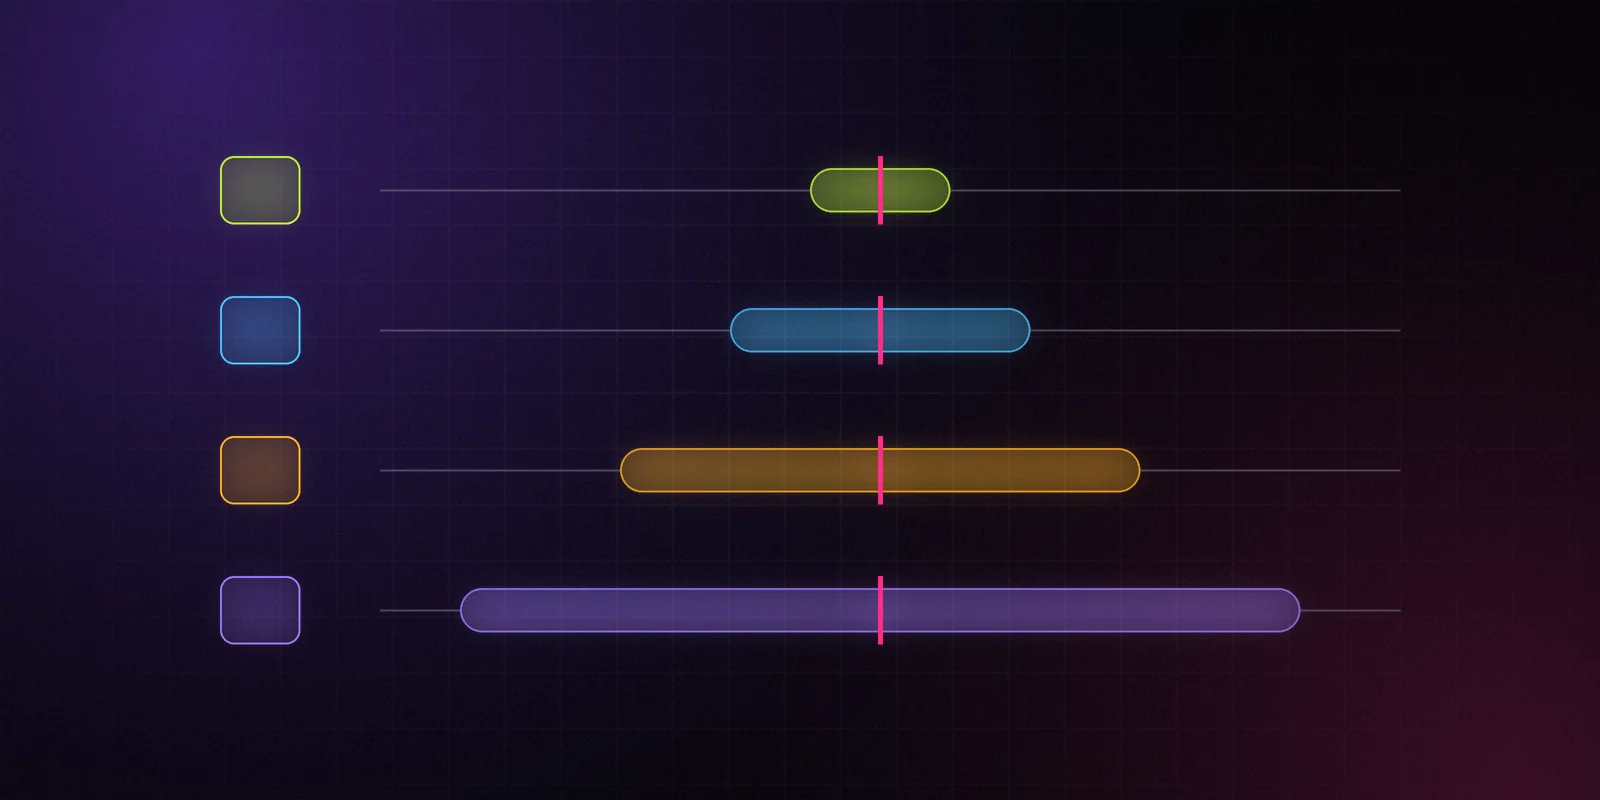
The band tells you how wide an estimate is. The grade tells you how much to trust the band. Here is what goes into each grade, why some segments get a D by rule, and how grades should change the way you use a number.
DataPussy Team
Methodology
Give Your AI Agent the App Market Over MCP
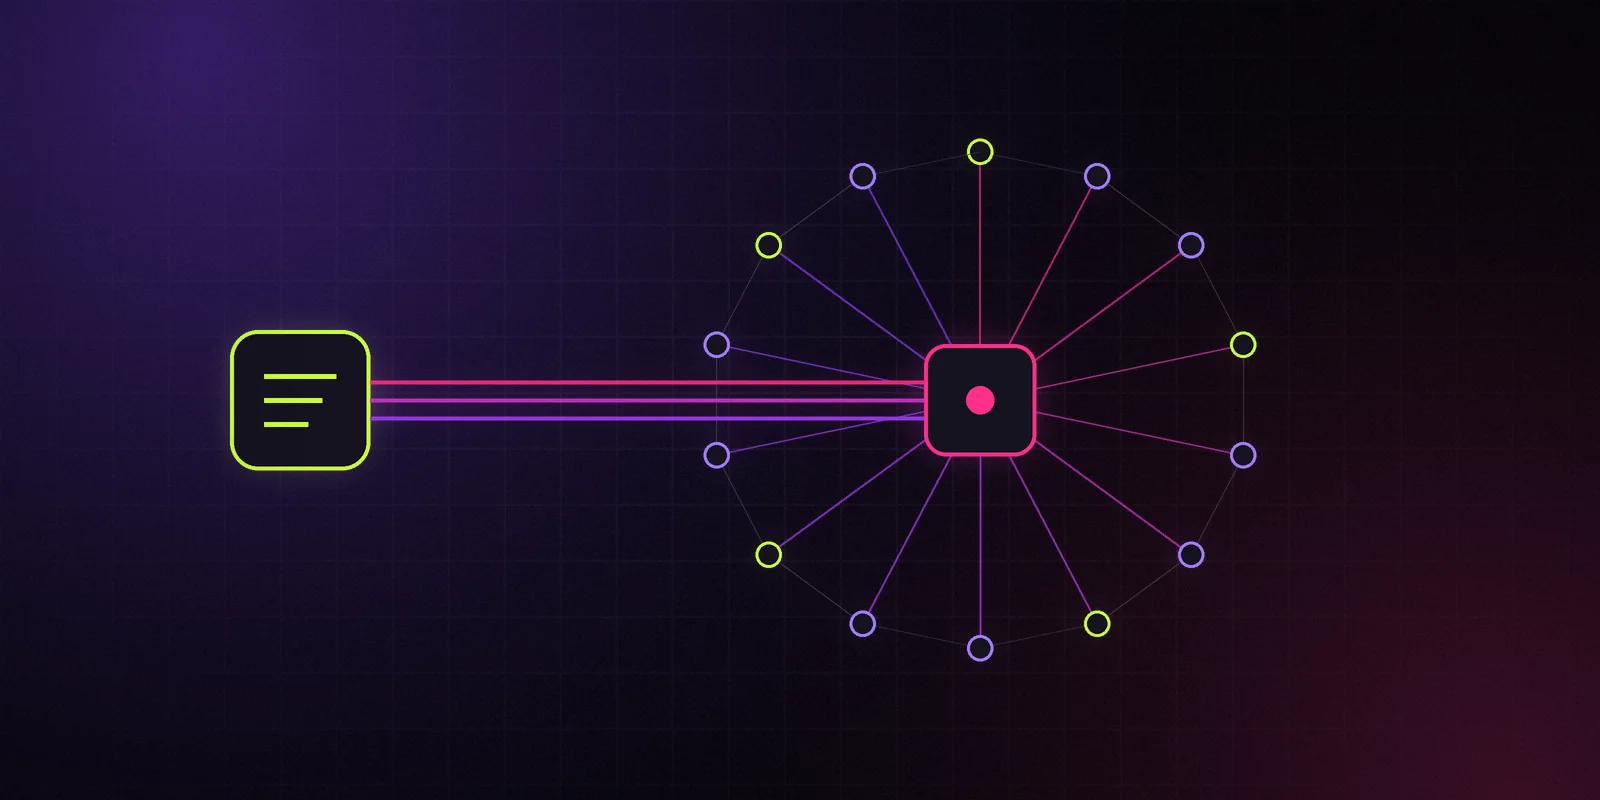
The DataPussy MCP server gives your agent 14 curated tools for app-market data, a concise and a detailed view, the cost of every call and OAuth 2.1 sign-in. Here is what it does, how to install it in Claude Code and Cursor, and prompts to start with.
DataPussy Team
Developer experience

Stop guessing in the dark.
The free plan, the first Data Drops and the private alpha go to the waitlist first.