What A, B, C and D Mean on a DataPussy Estimate
The band tells you how wide an estimate is. The grade tells you how much to trust the band. Here is what goes into each grade, why some segments get a D by rule, and how grades should change the way you use a number.
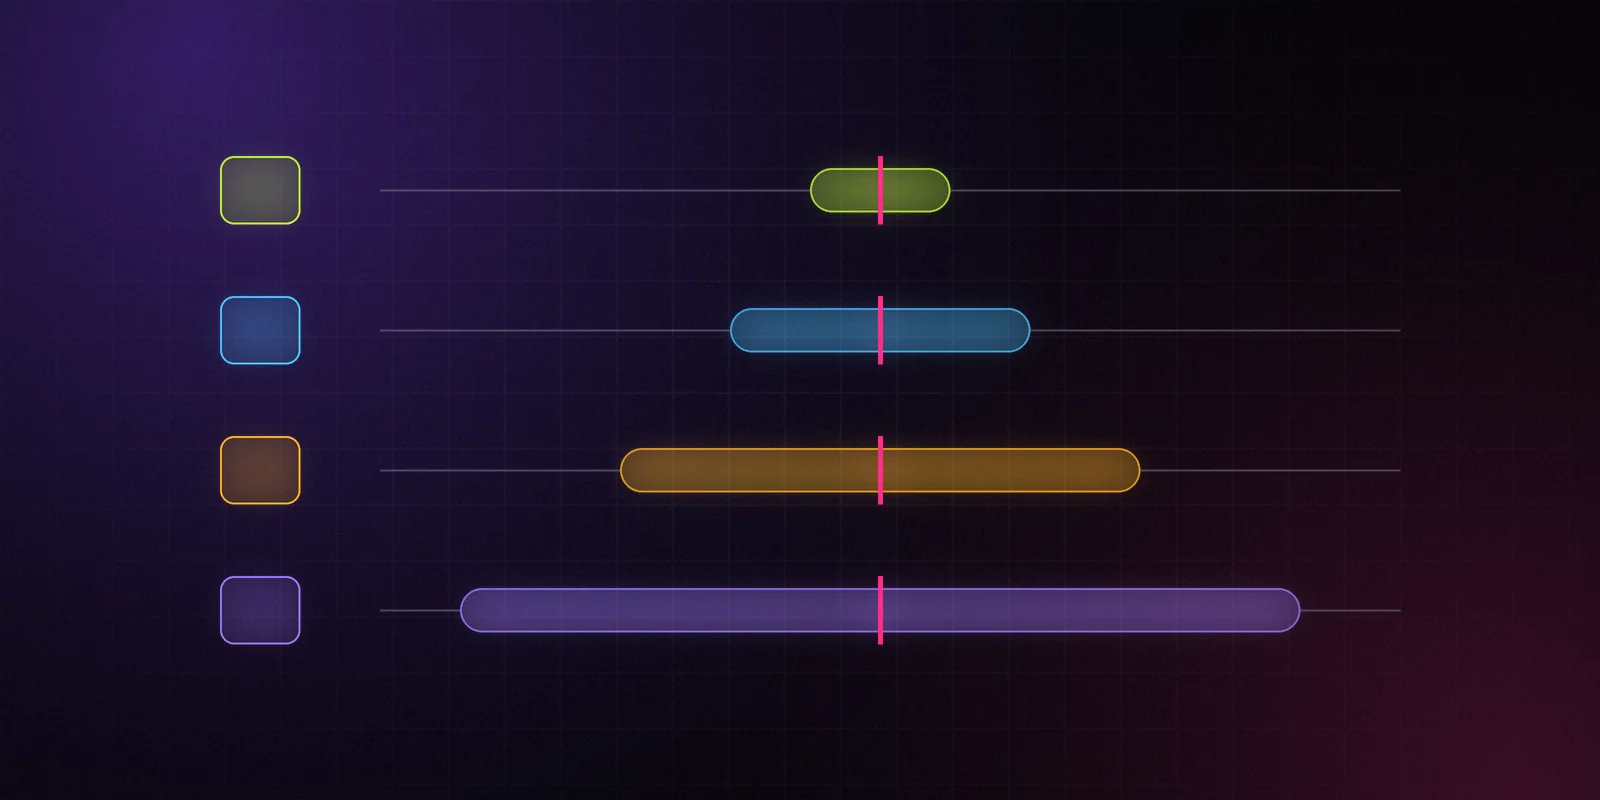
Grades are part of methodology v0. The definitions below describe the approach we're launching with. The inputs behind each grade will be refined as ground truth comes in, and every change will show up in the changelog and in the
method_versionof each estimate.
Every estimate on DataPussy has two kinds of honesty attached to it. The first is the band: P10, P50 and P90. The second is a letter from A to D.
They answer different questions. The band says "here's how wide the range is." The grade says "here's how much you should trust that range." You need both.
Why a Band Isn't Enough
A model can be confidently wrong. Imagine a segment where we have strong-looking public signals but no real data to check against. The model might produce a tight band there, because the inputs agree with each other. But tight isn't the same as correct. Without ground truth, we have no evidence that the band is honest in that segment.
The grade exists to catch exactly that case. It doesn't measure how narrow the band is. It measures how much evidence stands behind it.
What Goes Into a Grade
Three things decide the letter.
1. Inputs available. How many independent signals fed the estimate, and do they agree? A download estimate built from a steady chart position, a matching ratings trend and a consistent review velocity has more support than one built from a single day in a chart. For revenue, agreement with the Top Grossing chart adds support. The inputs_used field lists exactly what went in.
2. Calibration coverage. Have we checked this kind of estimate against real data, and did the bands hold up? Calibration comes from developers who connect RevenueCat or Stripe through Claim your app, and from partner apps that share real figures. A segment where real values regularly land inside our P10–P90 band earns trust. A segment where they often don't, loses it.
3. The segment itself. Platform, country, chart and category. Some segments are deep and stable. Others are small, volatile or new to us. The same model behaves differently across them, and the grade reflects where the estimate sits.
The Four Grades
A — Strong. Several independent inputs agree, and the segment is well calibrated: we have enough ground truth there, and our bands have held up against it. This is the only grade that gets the brand's lime highlight in the dashboard, because it's the closest thing to "seen clearly" we can offer.
B — Good. Solid inputs and a calibrated segment, but with fewer signals, some disagreement between them, or calibration borrowed from a closely related segment. Usable for most decisions. Check the band.
C — Weak. Limited inputs, such as an app with only a short chart history, or a segment with thin calibration. Treat the P50 as a rough pointer and lean on the band.
D — Unverified. We have no ground truth for this segment, or the inputs are too sparse to say anything solid. Any segment without ground truth gets a D by rule, no matter how good the inputs look. A D doesn't mean the estimate is wrong. It means we can't show you evidence that it's right.
At launch, iOS estimates ship as "calibrated on N apps", with N stated on the methodology page. Expect plenty of C and D grades early on. That's not a bug. It's what honest grading looks like before the ground truth piles up.
Band and Grade Together
The two signals combine in useful ways.
- Narrow band, grade A. The best case. Strong evidence, and the model has proved itself here.
- Wide band, grade A. The segment is well understood, but this particular app is hard to pin down. Trust the width.
- Narrow band, grade D. Be careful. The model is confident, but unproven in this segment. This is the combination a single-number tool would hide from you entirely.
- Wide band, grade D. We know very little. Use it as a direction, not a figure.
Using Grades in Practice
Grades are filterable everywhere. In App Explorer, add a grade chip to keep only the estimates you'd stake a decision on. In the API, grade is a filter like any other field.
Example request — illustrative, not real data:
curl "https://api.datapussy.com/v1/apps?store=ios&country=US&category=health-fitness&grade[in]=A,B" \
  -H "Authorization: Bearer $DATAPUSSY_API_KEY"
A few habits help:
- For a board deck or an investment memo, stick to A and B, and quote the band, not just the P50.
- For scouting, include C and D, but treat them as leads to investigate, not conclusions.
- For alerts, a jump in an A-grade estimate deserves attention. The same jump in a D-grade estimate deserves a second look before anyone panics.
How Grades Change
Grades aren't permanent. They move for three reasons.
More ground truth. When developers connect real data through Claim your app, or partner apps join, segments get calibrated and grades can rise. We test leave-one-out: an app's own data never feeds its own public estimate unless the developer agrees to show it.
A new method version. When a model improves, grades are recomputed under the new method_version, and the changelog says what moved.
Bad results. If the monthly accuracy bulletin shows that our bands missed in a segment, the grades in that segment go down. Grades that only ever go up would be decoration.
The Short Version
A letter next to a number is a small thing. It's also the difference between "here's a figure" and "here's a figure, and here's how much we'd bet on it." We'd rather hand you the second one, even when the honest answer is D.
More from the blog
Methodology, honest numbers and the tools around them.
How We Estimate Downloads, Revenue and Ad Spend (Methodology v0)
The three models behind every DataPussy estimate, what we observe and what we model, how grades work, what we refuse to show, and how the method gets versioned. Version 0, and subject to change.
DataPussy Team
Methodology
Why Every Number Ships With a Range
A single download figure hides how unsure the model is. Here is how to read P10, P50 and P90, why a wide band is information rather than failure, and how to make decisions with ranges.
DataPussy Team
Methodology
Give Your AI Agent the App Market Over MCP
The DataPussy MCP server gives your agent 14 curated tools for app-market data, a concise and a detailed view, the cost of every call and OAuth 2.1 sign-in. Here is what it does, how to install it in Claude Code and Cursor, and prompts to start with.
DataPussy Team
Developer experience

Stop guessing in the dark.
The free plan, the first Data Drops and the private alpha go to the waitlist first.