Why Every Number Ships With a Range
A single download figure hides how unsure the model is. Here is how to read P10, P50 and P90, why a wide band is information rather than failure, and how to make decisions with ranges.
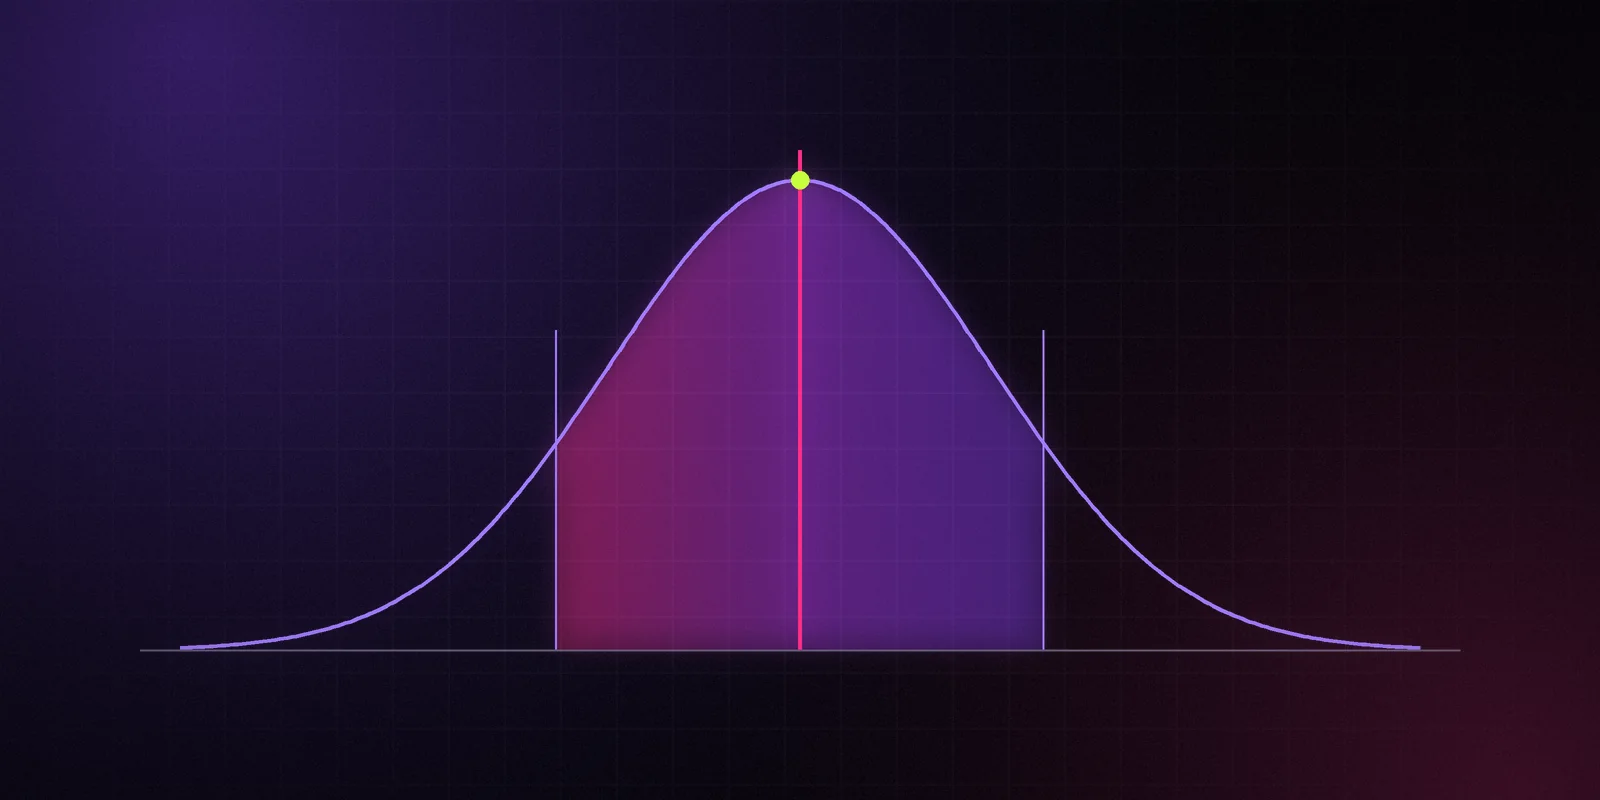
Here's a sentence you've read a hundred times, in one form or another: "This app made $1.2M last month." (Example — illustrative, not real data. The real ones look exactly the same, which is the problem.) It reads like a fact. It isn't one. Unless it came from the developer's own books, it's the output of a model, and the model had a margin of error it didn't tell you about.
We think that's the original sin of app intelligence. So every download, revenue and ad-spend figure we publish ships with a range.
A Single Number Is a Range With the Edges Cut Off
No one outside Apple and Google sees real download counts. Every third-party figure is inferred from chart ranks, ratings, prices and a stack of assumptions. Those inferences are uncertain. A tool that prints one confident number hasn't removed the uncertainty. It has hidden it from you.
Hidden uncertainty is worse than visible uncertainty, because you can't plan around what you can't see. You'll treat a rough guess about a small app with the same confidence as a well-supported estimate for a top-10 app. Both look like the same confident figure on the screen.
How to Read P10, P50 and P90
Every estimate has three values:
- P50 — the middle. Our best single guess. Half the probability sits below it, half above.
- P10 — the low edge. We think there's about a 10% chance the real value is below it.
- P90 — the high edge. We think there's about a 10% chance the real value is above it.
Together, P10 and P90 form an 80% band. If our model is well calibrated, the real value lands inside the band about 8 times out of 10. Not 10 out of 10. A band that always contains the truth is too wide to be useful.
Example — illustrative, not real data: a top-50 meditation app shows downloads over the last 30 days as P10 40k, P50 55k, P90 75k. Read it as: "Most likely around 55k. Probably between 40k and 75k. One time in ten, it'll be outside even that."
In the dashboard, the band is drawn as a soft fill and P50 as a solid line, so you see the range before you see the point.
Calibration: How We Keep the Band Honest
An 80% band is a promise you can check. If real values land inside it 8 times in 10, the band is honest. If they land inside 5 times in 10, the band is too narrow and we're overconfident. If they land inside every single time, the band is too wide and we're hedging.
So we check. Developers who connect RevenueCat or Stripe through Claim your app, and our partner apps, give us real figures. Once a month, the accuracy bulletin publishes how often real values landed inside our bands, segment by segment. When we miss, the bulletin shows it.
Wide Bands Are Information
When a band is wide, the instinct is to call it a failure. It's the opposite. A wide band is the model telling you something true: the evidence is thin, or the inputs disagree.
Bands get wide when:
- The app has been in the charts for only a few days.
- The category is small and we have little ground truth to calibrate it.
- Public signals pull in different directions, for example a strong rank with very slow review velocity.
- Revenue partly happens on the web, where we see only a slice.
A narrow band on a thin-evidence app would be a lie. We'd rather show you the honest width and let you decide what it's worth.
How to Make Decisions With Ranges
Ranges change how you compare and plan. A few habits help.
Compare bands, not points. If two apps' bands overlap heavily, you can't tell them apart, even if one P50 is higher. Don't build a strategy on a gap that sits inside the noise.
Use the edge that matches the risk. Sizing a market you're about to commit budget to? Plan on P10. Checking whether a category has room for a breakout? Look at P90. Writing one line in a summary? Use P50, and say it's an estimate.
Check the grade next to the band. The band tells you how wide the range is. The grade, from A to D, tells you how much to trust the band itself. A narrow band with a D means the model is confident but unproven in that segment.
Watch the band over time. A band that narrows as an app stays in the charts means evidence is piling up. A band that suddenly widens is worth a look.
Ranges Everywhere, Including Your Agent
Ranges only work if they survive the trip to wherever you use them. So p10 and p90 are in every view of the API, including the concise one. They're in the MCP server's concise view, in webhook payloads and in exports.
That last part matters more every month. If an AI agent summarizes the market for you and drops the ranges to save tokens, false precision sneaks back in through the side door. We don't give it the chance.
What You Won't See
Ranges don't make every number safe to publish. Below roughly 10k downloads or roughly $10k a month, we hide the point estimate entirely, because small numbers are where models are least reliable. The last 72 hours are flagged provisional. Web revenue is marked as a lower bound. Each of those flags rides along with the estimate, so nothing downstream mistakes a guess for a fact.
The Short Version
A range isn't us being vague. It's us being specific about how sure we are. Most tools give you a number and leave the doubt for you to discover later. We put the doubt on the screen, next to the number, where you can use it.
More from the blog
Methodology, honest numbers and the tools around them.
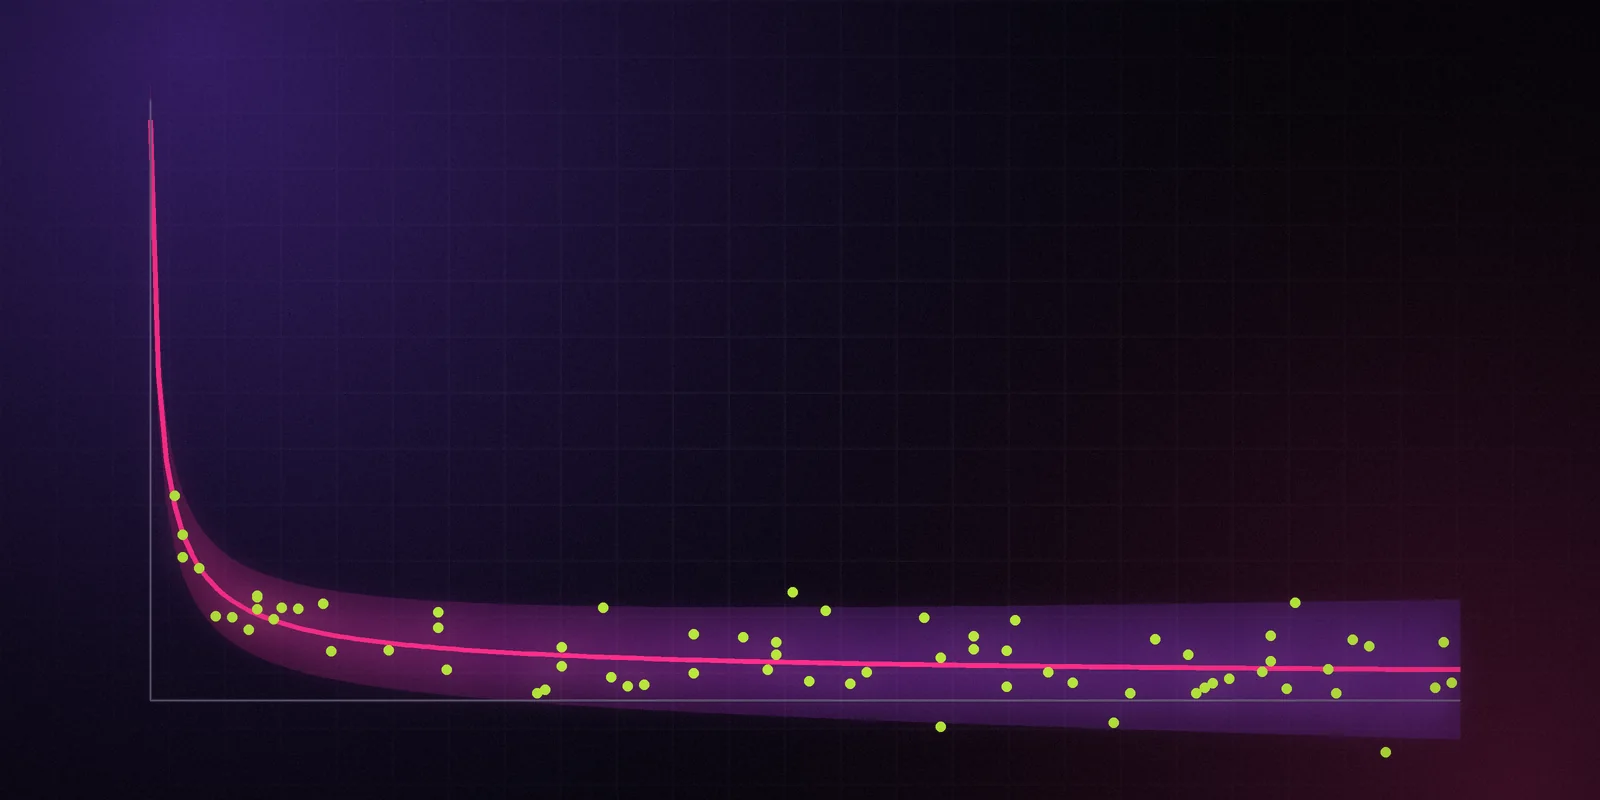
How We Estimate Downloads, Revenue and Ad Spend (Methodology v0)
The three models behind every DataPussy estimate, what we observe and what we model, how grades work, what we refuse to show, and how the method gets versioned. Version 0, and subject to change.
DataPussy Team
Methodology
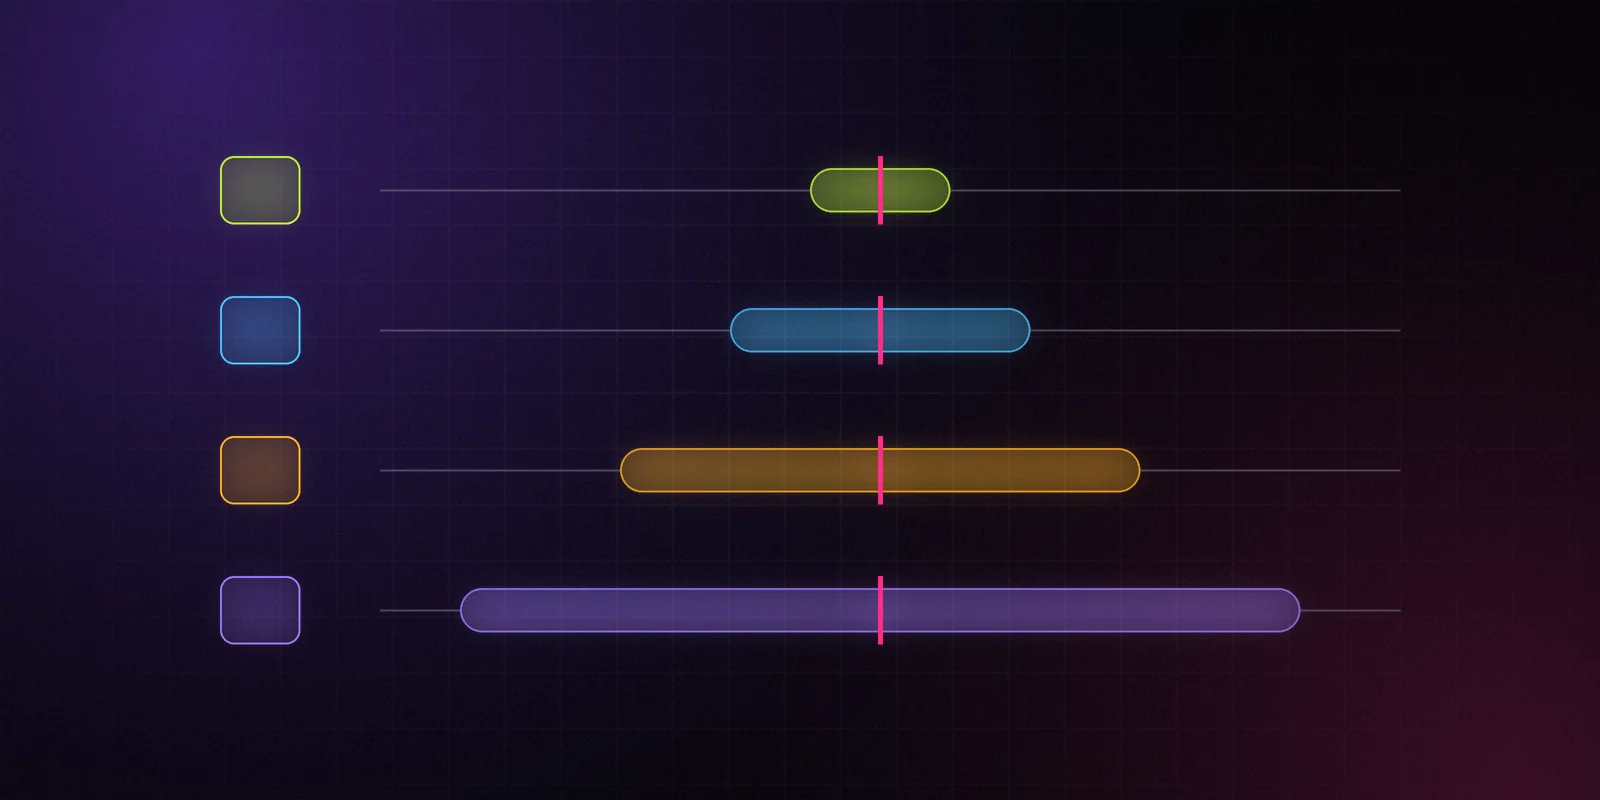
What A, B, C and D Mean on a DataPussy Estimate
The band tells you how wide an estimate is. The grade tells you how much to trust the band. Here is what goes into each grade, why some segments get a D by rule, and how grades should change the way you use a number.
DataPussy Team
Methodology
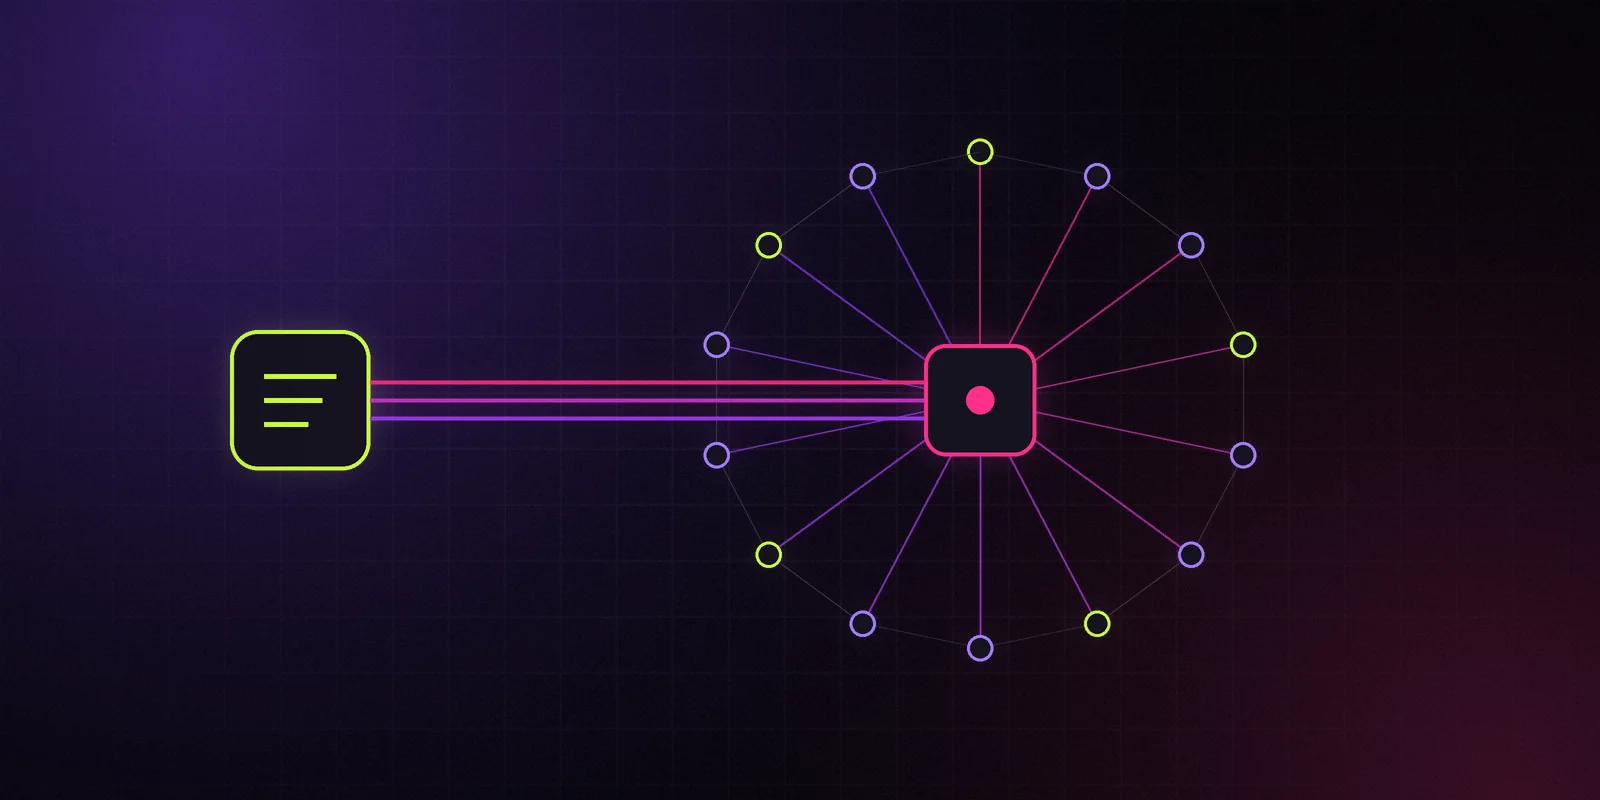
Give Your AI Agent the App Market Over MCP
The DataPussy MCP server gives your agent 14 curated tools for app-market data, a concise and a detailed view, the cost of every call and OAuth 2.1 sign-in. Here is what it does, how to install it in Claude Code and Cursor, and prompts to start with.
DataPussy Team
Developer experience

Stop guessing in the dark.
The free plan, the first Data Drops and the private alpha go to the waitlist first.