Status
Planned. This page describes the study before we run it. It contains no results and no numbers to be read as findings. When the drop ships, the chart, the CSV and the method note will appear here.
The Question
Which paywall patterns do the top Health & Fitness apps show in their store listings, and how do those patterns differ between the App Store and Google Play?
We'll sort every app into one or more of these patterns, based only on what its public store listing shows:
- Hard paywall during onboarding.
- Free trial that rolls into a subscription.
- Freemium, with some features gated.
- Lifetime purchase offered next to a subscription.
- Ads, with a purchase to remove them.
- Paid upfront.
- No paywall visible in the listing.
Why It Matters
Paywall type is one of the inputs to how we estimate revenue: downloads × conversion by paywall type × price × a regional index. So we need a careful read of paywall patterns anyway. Publishing it lets you see the input, check it against your own category knowledge and tell us where it's wrong.
Sources
- Public App Store product pages and Google Play store pages: screenshots, the listed in-app purchases and prices.
- Apple's official RSS chart feeds to pick the apps: the Health & Fitness Top Free and Top Grossing charts, US store. The matching Google Play charts for the Play side.
- A vision model that reads each screenshot set and returns JSON that follows a fixed schema.
Pages are read without logging in, with an honest User-Agent and inside our request budget for each source. Screenshots are processed only when their hash changes.
Method
- Fix a date. Take every app in the US Health & Fitness Top Free and Top Grossing charts on both stores, as deep as the public charts go.
- Exclude apps published by individual people. This drop covers companies only.
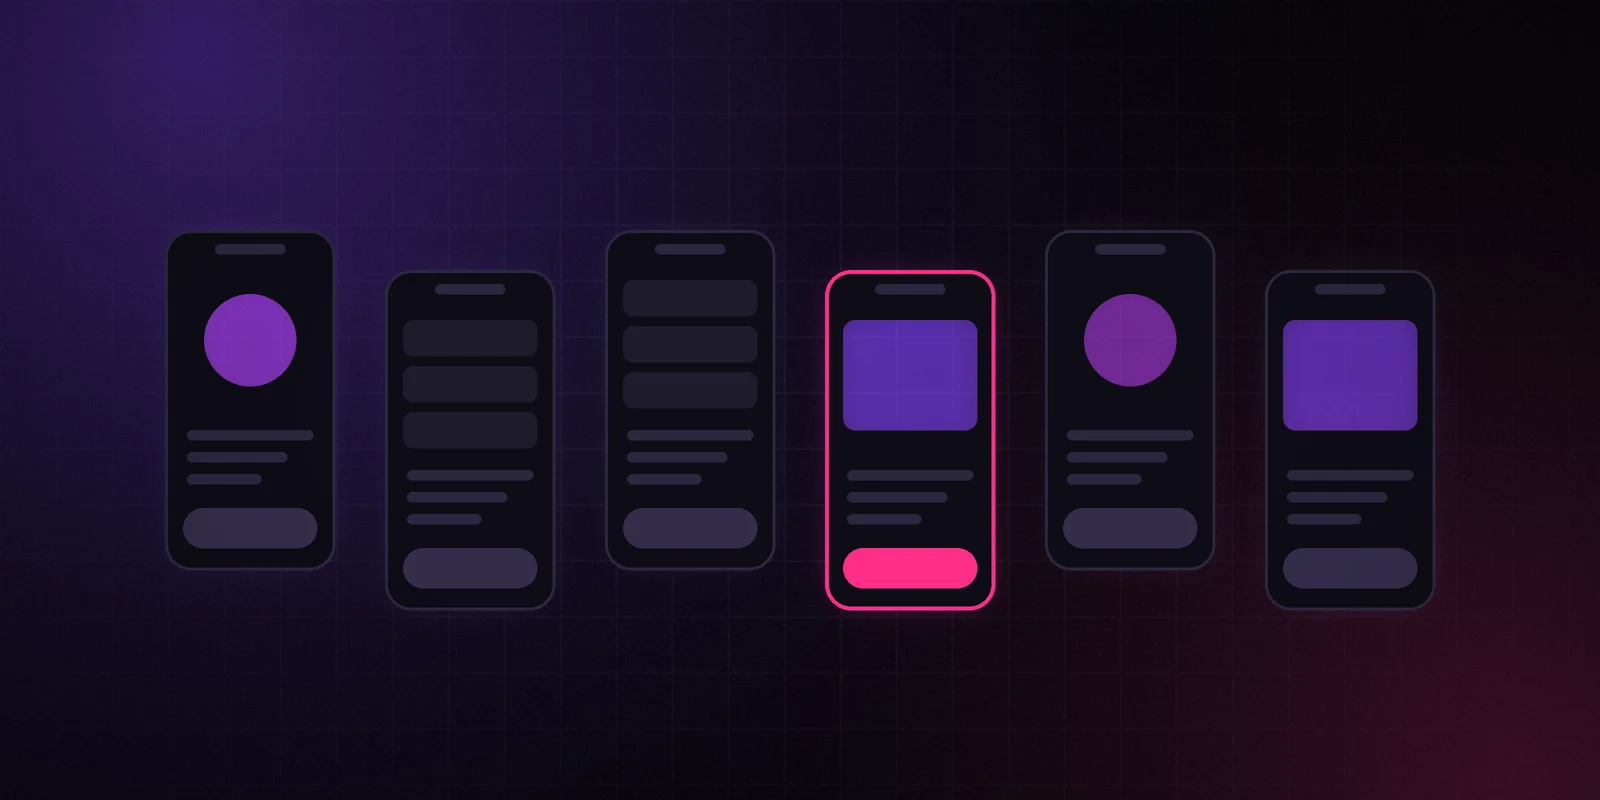
- Fetch the screenshot set and the listed in-app purchases from each public store page.
- Run the vision model with a fixed prompt and schema. For each app it returns fields such as
paywall_types,trial_shown,trial_length_shown,lifetime_option_shown,price_points_listedand aconfidencescore. - A person on our team checks a random sample of apps against the model's output. We'll publish the agreement rate next to the results, whatever it turns out to be.
- Report the share of apps per pattern, per store and per chart, with the count behind every share.
What You'll Be Able to Download
- CSV — one row per app, with
store,country,app_id,chart,rank_on_date, the pattern fields above,confidence,screenshot_hashandmodel_version. Facts from public listings only, plus a link to each store page. - Chart — share of apps per paywall pattern, iOS next to Google Play.
- Method note — the schema, the prompt version, the sampling rule for the human check and every exclusion.
We won't re-host screenshots. The CSV points to the store pages, and the screenshot hash lets you confirm which version of a listing we read.
Caveats
- Store screenshots are marketing. They show what a developer chooses to advertise, not necessarily the paywall inside the app. This drop measures what is shown in the listing, and says so in every chart title.
- The public in-app purchase list may not include every purchase option, and prices vary by country.
- Vision models misread things. The human check measures how often, and low-confidence rows are flagged, not hidden.
- One chart, one country, one date. Treat it as a snapshot, not a trend.
- The screenshot library is a Beta feature at launch, so coverage of a few listings may be incomplete.