Status
Planned. This page describes the study before we run it. There are no results here yet, and no numbers that should be read as findings. When the drop is published, this page will hold the chart, the CSV and the method note, stamped with the method version that produced them.
The Question
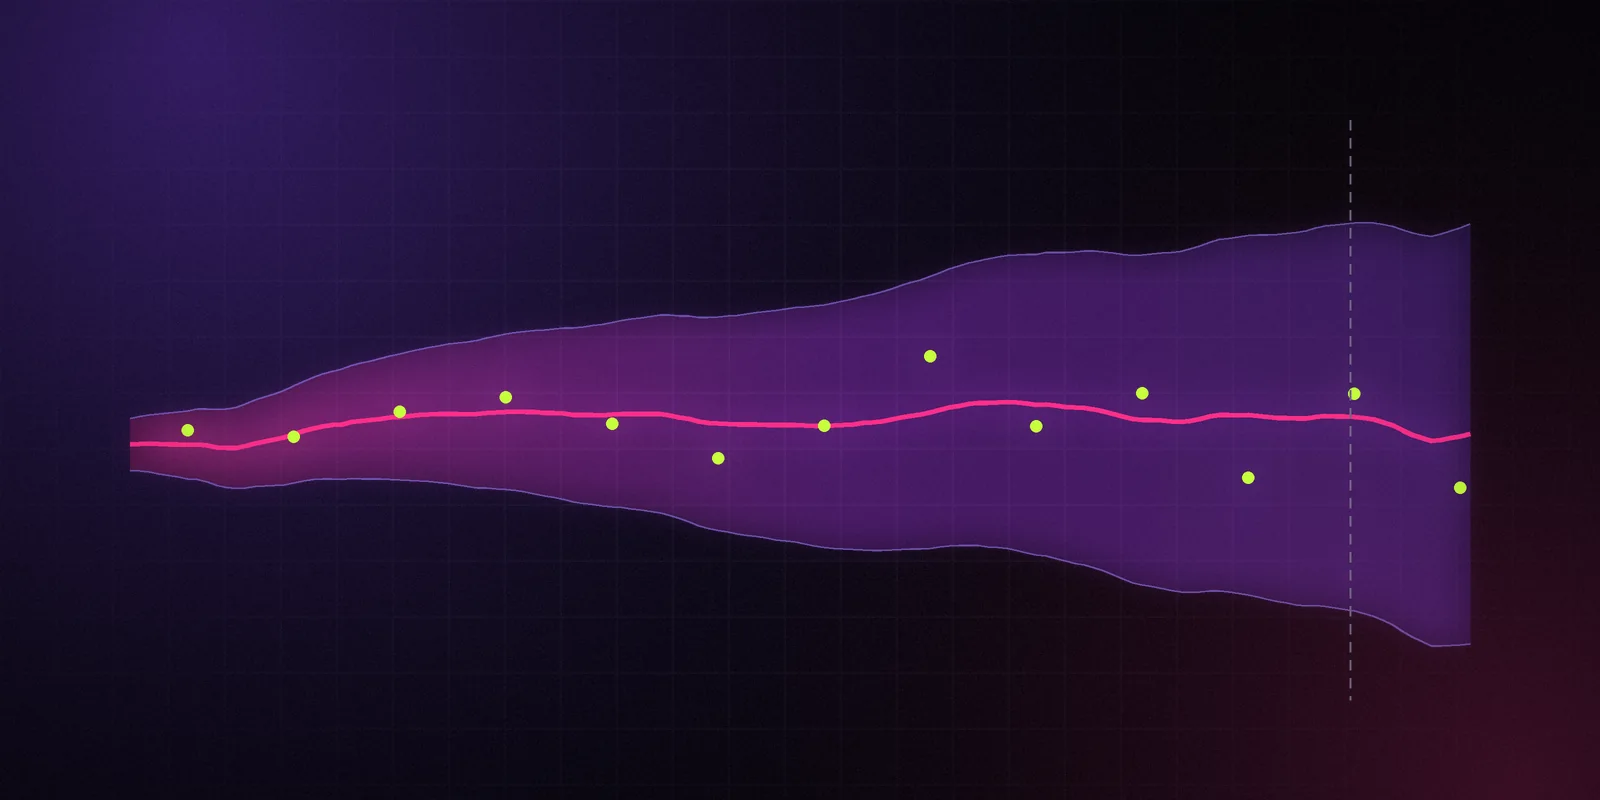
How wide is the P10–P90 band of our download estimates at different chart ranks on the iOS US store?
Every download figure we publish comes with a range. You should know, before you use a number, how much range to expect at a given rank. Is an estimate for a top-10 app in a busy category as tight as one for an app that appears near the bottom of a niche chart? This drop answers that with our own data, in public.
Why It Matters
A band is not decoration. It tells you how much a decision can lean on a number. If you're sizing a category, comparing two competitors or deciding whether a rival's launch moved the needle, the width of the band at that rank matters as much as the middle value. This drop gives you a rule of thumb you can check against, instead of guessing.
Sources
- Apple's official RSS chart feeds for the US store: Top Free and Top Paid, overall and per category.
- Apple's official iTunes Lookup API for app metadata and ratings.
- DataPussy download estimates from M1, our rank-to-downloads model, with
p10,p50,p90,gradeandmethod_versionon every row.
No logins, no private data, and nothing from Apple beyond what its public endpoints publish.
Method
- Take a fixed window of daily snapshots of the US Top Free and Top Paid charts, overall and per category. Top Grossing is left out because it ranks revenue, not downloads.
- Join each chart position to that day's download estimate for the app.
- Drop days flagged
provisional(the last 72 hours). Count, but don't measure, estimates flaggedsuppressed. - For every estimate, compute two widths: the ratio P90 ÷ P10, and the relative width (P90 − P10) ÷ P50.
- Group by rank bucket (1–10, 11–25, 26–50, 51–100, and deeper buckets where the feeds go deeper), by chart and by category.
- Report the median and the interquartile range of each width per group, the number of apps behind it and the mix of grades A to D.
- Suppress any group with too few apps to say anything, using the same minimum cell size as the accuracy bulletin.
What You'll Be Able to Download
- CSV — one row per date, chart, category and rank bucket, with columns such as
n_apps,median_ratio_p90_p10,iqr_ratio_low,iqr_ratio_high,median_relative_width,share_grade_athroughshare_grade_d,n_suppressedandmethod_version. Aggregates only, no app-level rows. - Chart — band width by rank bucket, one line per chart, with the interquartile range shaded.
- Method note — the exact steps above, the window, the minimum cell size and every exclusion, so you can reproduce or challenge the result.
Caveats
- This measures our model, not the market. A narrow band means our model is confident. It doesn't prove the model is right. That is what the monthly accuracy bulletin is for.
- Band widths depend on the method version, which is stamped on every row. A new version can change them, and the changelog will say how.
- iOS US only. Other countries and Google Play will behave differently, and Play's public install brackets add their own uncertainty.
- Rank buckets beyond the depth of the official feeds can't be measured from charts alone.
- All figures are "Estimate — modeled". None of them come from Apple or from app publishers.