Status
Planned. This page lays out the study before we have the data to run it. It holds no results and no numbers that should be read as findings. We're writing the method down first on purpose: it keeps us from tuning the analysis until it says something exciting.
The Question
When an app starts a burst of Meta ads in the EU, does its chart rank move afterward? If it does, how many days later, and by how much compared with similar apps that didn't advertise?
Why It Matters
If ad activity reliably shows up before chart movement, watching a rival's ads is an early warning. If it doesn't, that's worth knowing too, before you build alerts on a signal that doesn't carry information. Either answer is useful. We'll publish whichever one the data gives us.
Sources
- Meta's official Ad Library API, EU slice: ads, their start and stop dates and their reach.
- Apple's official RSS chart feeds for Germany, France and Spain, the three EU countries in our launch set.
- DataPussy spend bands from M4: reach × frequency × CPM, shown as P10, P50 and P90. Labeled "Estimate — modeled".
Method
- Link ads to apps through the store links in the ad or its landing page. Ads that can't be matched to a single app are dropped.
- For each app, build a daily series of active ads and newly started ads per country.
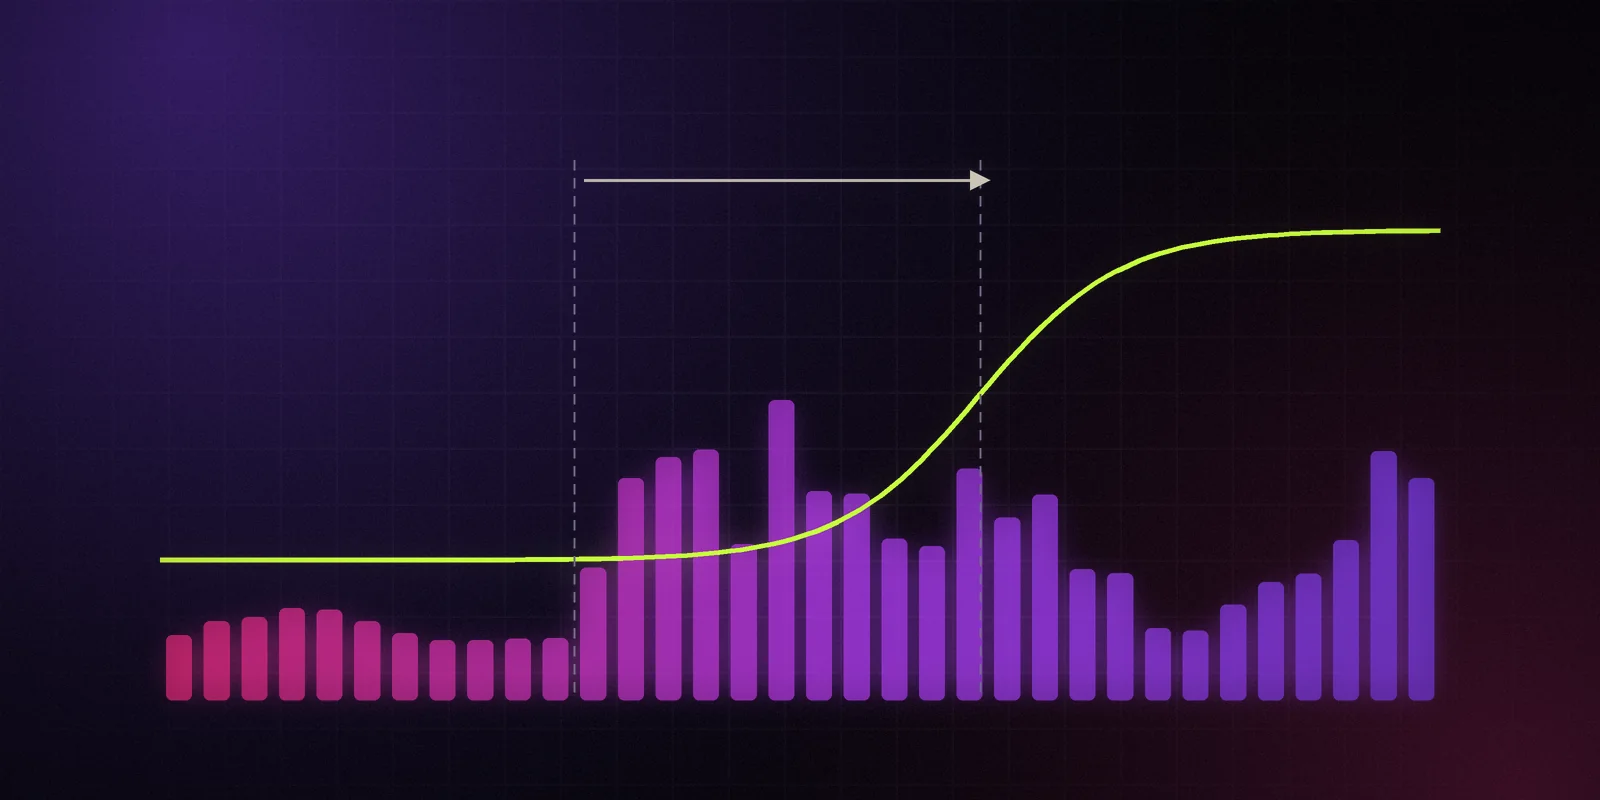
- Define a burst as a run of new ads well above that app's own recent baseline. The exact threshold goes in the method note before we look at outcomes.
- Build an event study: track the app's chart rank from 14 days before the burst to 28 days after.
- Match every advertising app with control apps from the same category and a similar starting rank that had no burst in the same window.
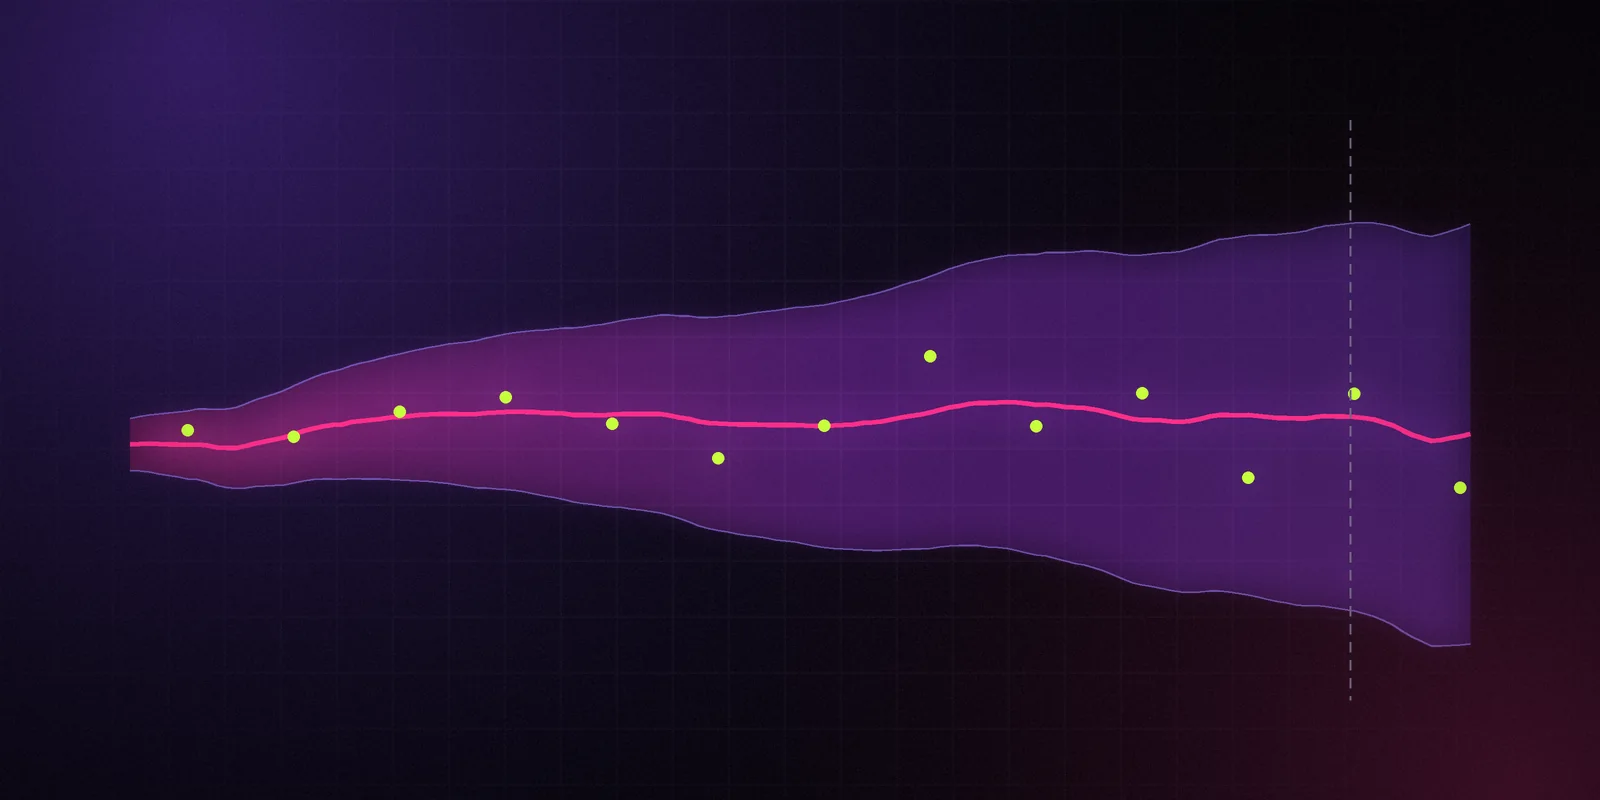
- Compare rank changes between the two groups at each lag, with confidence intervals.
- As a second check, compute the lead-lag correlation between daily ad activity and rank changes across all apps, by category.
- Report every category we test, including the ones where nothing happens.
What You'll Be Able to Download
- CSV — aggregates only:
country,category,lag_days,n_events,median_rank_change_treated,median_rank_change_control,ci_low,ci_high,method_version. - Chart — rank change around ad bursts, advertising apps against matched controls, by day.
- Method note — the burst threshold, the matching rule, the lag window and every exclusion, fixed before the analysis.
Raw Ad Library fields aren't part of the download. You get derived aggregates, with links back to the official library for anyone who wants to look at the ads themselves.
Caveats
- Correlation is not causation. Ad bursts often coincide with launches, feature releases, press or seasonal demand, and those move charts too. Matching reduces that problem. It doesn't remove it.
- Meta only. Ads on TikTok, Google or Apple Search Ads aren't in this study, so an app that seems to move without ads may simply be advertising elsewhere.
- EU only, and three countries. Results may not carry over to the US or to other markets.
- Spend bands are modeled and in Beta. Wide bands are reported as wide.
- Ads that send people to a website instead of a store page are hard to match, so web-to-app funnels are under-counted.